Measure OTF of the lens-sensor system
From ElphelWiki
Revision as of 11:33, 20 November 2017 by Andrey.filippov (talk | contribs)
This is a legacy page. Information may not reflect the current state of the products or code. See more about lens measurements on Elphel Blog: Category:calibration
Contents
Software
Note:
1.1. Copy the source to the "Plugins" folder of the ImageJ installation
1.2 Launch ImageJ
1.3 Drop down menu "Plugins -> Compile and Run..."

2.1 It might be useful getting the following plugins as well:
 JP46_Reader.java - converts JP46
 Crosstalk_Deconv.java - can generate simulation pattern
Test Pattern
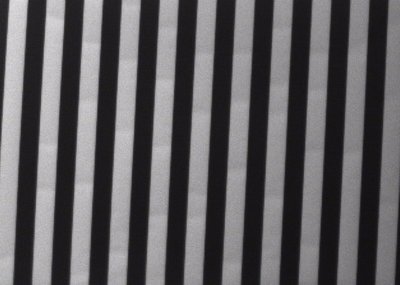
Print the test pattern (A) or generate it (B).
A - print
- The stripes on the paper are vertical of course. But there should be a small angle on the test image.
- Each stripe width on the test image should be not less than 32 pixels
- The minimum is 3 stripes: BWB or WBW.
B - generate
- Get Crosstalk_Deconv.java - compile and run
- Click Create Color Pattern
- Choose Pattern Type
- Set Nonlinearity to 1 (square)
- Set the stripes period (each stripe width on the test image should be not less than 32 pixels)
- OK - the plugin generates only RED, GREEN or BLUE stripes - so it will be like color filter. RED will be ok.
Camera Settings
| Gamma | 1.0 |
| Black Level | 0.0 |
| Color Saturation | 0.0 |
| Image Quality | 100% |
| Color Sensor Mode | Mono |
Note:
Set the Color Sensor Mode to Mono only when Color Saturation is 0.0
ImageJ
1. Save the image of the test pattern.
2. Launch ImageJ - open the saved image and launch the plugin
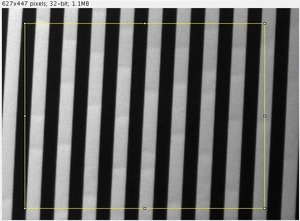
3. Select the area of the measurement.
 Note:
 Should contain at least 2 edges - 1x Black-to-White & 1x White-to-Black but the more edges in the area of interest the better
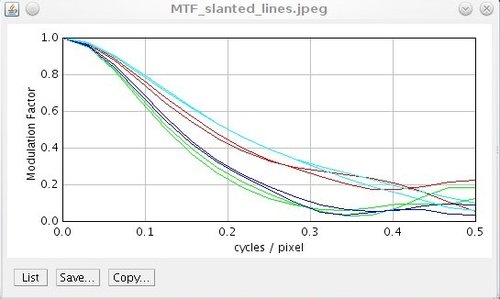
4. Process - the MTF chart will be shown
Note:
Change the image type in ImageJ to 32-bit if you are getting an error: drop-down menu Image -> Type
5. Show MTF text for spreadsheet use.
Results
- The higher curve the better.
- Normally the blue channel has the worst curve.


